

On the MCAS math tests in Grades 3-8, Hopkinton had the highest percentage of students meeting or exceeding expectations of any public school in Massachusetts.
Also in those grades, the district was one of 63 state-wide to have its math scores return to or surpass pre-pandemic levels.
Jeff LaBroad, assistant superintendent of curriculum and instruction, highlighted the MCAS results during Thursday’s School Committee meeting.
LaBroad noted the district uses a range of assessments to monitor and evaluate how students are progressing.
“MCAS is only one piece of the puzzle when looking at our students,” LaBroad said. The various assessments “help us understand what our learners need and how we can support them.”
The review included data showing the percentage of students from Grades 3-10 who met or exceeded expectations. The results ranged from 65% and 69% in Grades 3 and 4 up to 80% and 84% in Grades 8 and 10 for English/language arts.
The grades in between ranged from 70% to 76%.
For math, the percentages ranged from 71% in Grade 3 up to 82% in Grades 5, 6 and 8. The remaining grades primarily were in the high 70s.
In science, technology and engineering (STE), Grades 5 and 10 were at 80%, and Grade 8 was 72%.
LaBroad explained that civics was included for the first time (following a pilot program). In Grade 8, 78% of Hopkinton students met or exceeded expectations. He said this result was double the state average and ranked third in Massachusetts.
The assistant superintendent said although MCAS no longer are part of graduation requirements, there was no dramatic shift in results, demonstrating that “students still want to show what they know.”
School Committee member Nancy Cavanaugh said that when she looks at the percentages, she thinks about the other side of things. “I know these are great [results], but to me, 20% or 16% [not meeting or exceeding expectations] is not. That is surprising to me.”
LaBroad said educators think the same way, analyzing the other side to see what they are doing and how they can get those percentages to improve.
School Committee member Chris Masters asked about the students who did not meet or exceed expectations and where their results landed.
LaBroad clarified that most of those students “partially” met expectations, with “nearly none” not meeting expectations.
Comparisons with other districts included
Part of the presentation included a comparison with other districts across the state and how Hopkinton measured up in the number of students meeting or exceeding expectations. For example, in English/language arts, Hopkinton ranked seventh in Grades 4, 5, 6 and 10 and third in Grade 8.
In math, Hopkinton was first in Grade 5 (tied with Brimfield) when compared with all public, non-charter school districts in Massachusetts. Other highlights were second-place rankings in Grades 2 and 8 and fifth in Grades 4 and 7.
In Grades 5, 8 and 10, the district ranked seventh, eighth and ninth, respectively, in the state for STE.
LaBroad said educators look at results such as landing first in Grade 5 math and ask themselves why that is the case and how they can translate that success to other grades and subjects.
Student growth examined
The assistant superintendent also outlined “student growth,” which he said is an important area where the district has the “power to influence and move the needle.”
The model used is that under 39% indicates low growth, between 40-59% means typical or moderate growth, and 60% or more is high growth. Hopkinton’s results generally were 50% or higher. LaBroad noted, “The model says we can feel good about that.”
He also highlighted subgroups such as students with disabilities and how they fared when measured with students overall.
In Grade 10, the growth percentage was 51% overall, but higher (56%) in the subgroup of students with disabilities. In Grade 6 math, both students with disabilities and overall were at 59%, accomplishments LaBroad described as “huge.”
Although student growth across the grades generally was positive, LaBroad pointed out that only 25% of eighth grade students with disabilities fell into the “met or exceeded expectations” category in civics.
LaBroad said that he had an “early, unscientific hypothesis” as to why this result might be happening. He noted that students with disabilities requiring intervention outside of the classroom are not removed from elementary math or literacy courses. But they can be pulled from social studies.
He said if this is the case, the district would look to see if there is something it can do to make changes there.
He spoke about the various programs in place to help students and said district leaders would use the MCAS information to “enhance what we are doing so every student can get what they need every day.”
LaBroad noted Hopkinton’s students, teachers and schools are “so much more than test scores. … But that doesn’t mean we do not want to use the [results] to help make decisions.”
Superintendent highlights events
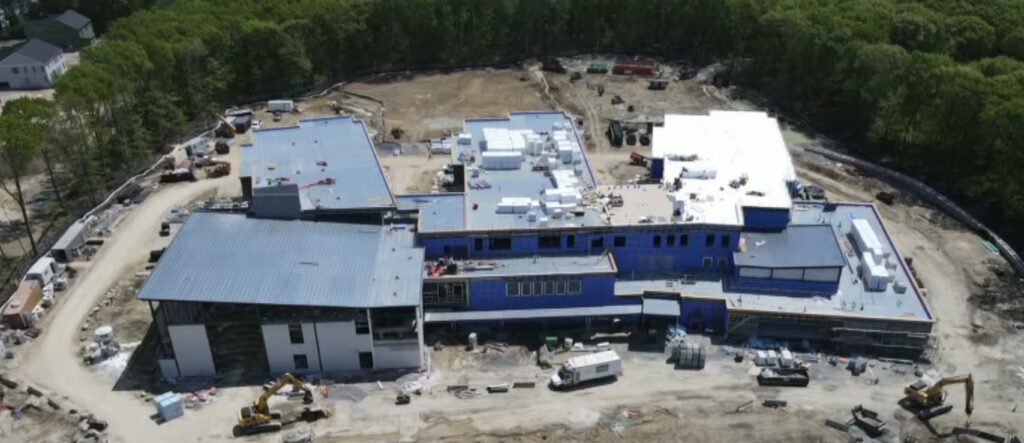
In other business, Superintendent Evan Bishop talked about the successful groundbreaking ceremony at the Charleswood School site on Tuesday.
“It was really nice to feel the sense of pride and shared ownership on this project,” Bishop said, “not only on this day but throughout the many years this project has been in the works.”
He also referred to Tuesday’s district professional development day for pre-K to Grade 12 educators. The day featured 45 staff workshops led by 59 Hopkinton faculty members and 13 partner presenters.
Topics included culturally responsive practices, supporting struggling learners, AI, leadership and more.


0 Comments